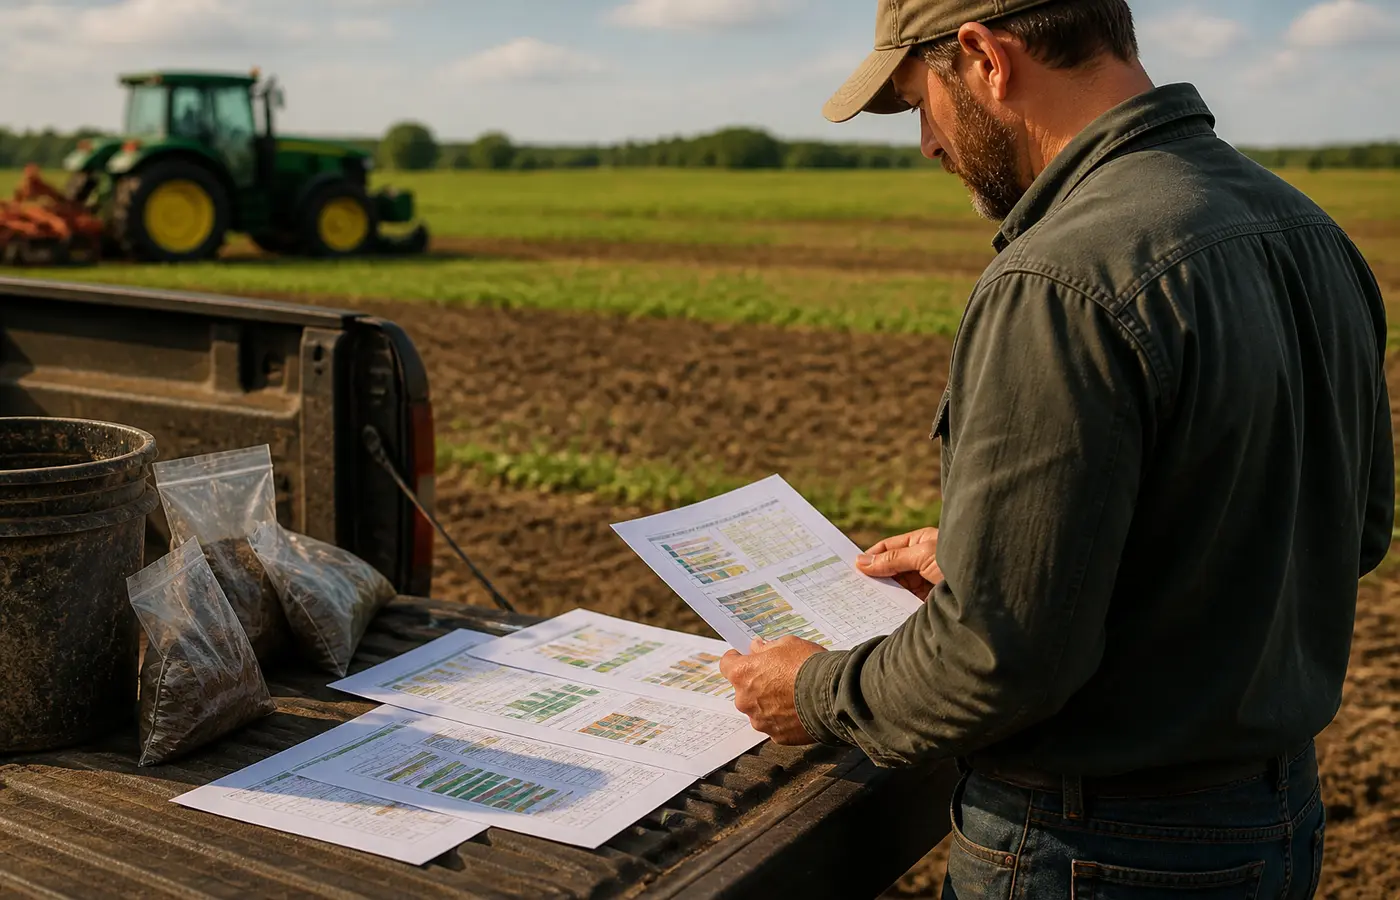
A soil test report can support a better farm decision, but it is not a complete description of a field on its own. Before acting on any pH, nutrient or soil-health number, confirm what the submitted sample represents, how the laboratory measured it, and whether the result can be compared fairly with other samples or earlier reports.
The practical task is to turn a report into a documented question: What does this result describe, what might it mean in this management area, and what further local information is needed before a decision is made? This approach is more reliable than treating one indicator or one laboratory category as a complete diagnosis of soil condition.
Start with what the sample represents
A laboratory can analyse the soil delivered to it. It cannot automatically determine whether that soil represents an entire farm, a whole field or a specific management zone.
Start by locating the sample on a map or field record. Note whether it came from one relatively uniform area or was combined from areas with different slopes, textures, drainage patterns, cropping histories or input histories. A composite sample can be useful when its component cores genuinely represent a common management area. If the cores combine unlike areas, the resulting number may hide differences that matter operationally.
Guidance from the University of Missouri Extension stresses that representative sampling, consistent depth and separation of different soil or management areas are important for meaningful results over time. Similarly, UF/IFAS Extension guidance describes a composite sample as representing an area that is uniform in management and topography.
For each report, retain the following context before considering interpretation:
- field, block or zone identifier;
- sampling date and person or team responsible;
- sampling depth;
- approximate core locations and whether they were composited;
- recent crop, intended crop or production purpose;
- recent nutrient, manure, compost or other soil-input history;
- residue handling, tillage and land-use history where relevant;
- irrigation, drainage, flooding or erosion context; and
- unusual conditions, such as a former livestock area, headland, banded-input zone or visibly distinct patch.
This record does not make a sample perfectly representative. It makes the limits of the sample visible. That is essential when a report is handed from a farm manager to an agronomist, buyer, laboratory or operations team.
Separate laboratory measurements from the report’s interpretation
A soil test report usually contains several layers of information. They should not be treated as interchangeable.
First is the measured analytical value: the result generated by the laboratory procedure for the submitted sample. Second are the unit and method, which indicate how the result was expressed and obtained. Third may be an interpretive category, such as a rating, index or sufficiency class defined by that laboratory. Finally, a report may include a recommendation linked to a crop, production objective or local advisory system.
The distinction matters because a raw result is not automatically a management instruction. UMass Amherst’s Soil and Plant Nutrient Testing Laboratory notes that analytical values need interpretation before they become useful in decision-making. That interpretation depends on the laboratory’s method, its calibration framework and the production context supplied with the sample.
When reading a report, preserve the original wording rather than converting values into an informal shorthand. Record:
| Report element | What to retain | Why it matters |
|---|---|---|
| Analytical result | The stated value and unit | Units may not be directly comparable between reports. |
| Test method | Extraction, procedure or method label where shown | The method affects what the reported value represents. |
| Interpretation | The laboratory’s exact category or legend | Categories are defined within a particular reporting system. |
| Crop or purpose | Crop, land use or production objective supplied | Recommendations may depend on this stated objective. |
| Recommendation notes | Conditions, assumptions and limitations | These can identify information needed for a decision. |
Penn State Extension also cautions that laboratories and report formats differ. A phosphorus, potassium or magnesium result reported by one laboratory should therefore not be assumed to have the same meaning as a similarly named result from another report. Before comparing numbers, check the units, methods and interpretive basis.
Read the main indicators as a combined operating picture
A report may include pH, nutrient measurements and additional biological, chemical or physical indicators. Each can answer a different question. None should be treated as a complete measure of soil condition, crop potential or farm performance.
pH: an acidity or alkalinity measurement
pH is commonly included because it is part of the soil environment in which other processes occur. Read it alongside sampling depth, laboratory method, crop objective and the laboratory’s interpretation. A pH value from one depth or management zone may not describe another depth or zone.
Nutrient results: results from a stated procedure
Reports commonly include nutrient indicators such as phosphorus, potassium and magnesium. Their usefulness depends on the procedure used, the report’s units, the crop and the local interpretive framework. A nutrient result is not evidence by itself that a particular material, rate or timing should be used.
Keep recent management visible here. For example, a zone with concentrated past inputs, manure history, residue accumulation or variable placement practices may deserve separate consideration from the rest of a field. The point is not to presume a cause from the result. It is to identify relevant history before drawing one.
Soil-health and physical indicators: context-sensitive signals
Some reports include measurements described as soil-health, biological, carbon-related or physical indicators. These may help structure observation and comparison, but their meaning can be sensitive to soil type, season, moisture, sampling handling, land use and method.
How to Understand and Interpret Soil Health Tests, published by Purdue Extension, highlights field variability and the need to interpret soil-health measures in context. It is useful as a general reading framework, not as a source of China-specific thresholds or farm instructions.
ACA’s practical interpretation is to ask what each indicator adds to the operating picture. A pH result, a nutrient extraction result and a soil-health score may all be valid laboratory outputs while describing different properties or processes. A higher or lower value in one column does not settle the meaning of the others.
Build a record that makes comparisons possible
A soil-testing programme becomes more useful when the farm can compare like with like. The aim is not simply to accumulate reports. It is to preserve enough continuity that changes can be investigated rather than guessed at.
Create one record for each sample or management zone. A spreadsheet, field-management platform or carefully labelled paper file can work if the team uses it consistently.
A practical record template includes:
- Sample identity: farm, field, block, zone and map reference.
- Sampling design: date, depth, number of cores, composite approach and any avoided or separately sampled areas.
- Production context: current crop, intended crop, rotation position and relevant production objective.
- Management history: recent inputs, organic materials, tillage, residue treatment, irrigation and drainage events.
- Laboratory information: laboratory name, report date, test methods, units and report version where available.
- Interpretation record: laboratory category, local adviser comments and questions still unresolved.
- Follow-up record: any later observations, additional samples or decisions made, clearly separated from the original analytical result.
Consistency is especially important when comparing results over time. If sampling depth changes, the sampled zone changes, the laboratory method changes or the field management differs substantially, the numbers may still be informative, but they are not a simple before-and-after comparison.
For example, a later report may show a different result from an earlier report. Before calling this a field change, check whether both samples came from the same mapped area, were taken at the same depth, used comparable procedures and had similar pre-sampling conditions. If not, document the difference rather than forcing a trend line.
Use differences between results as questions, not automatic instructions
Differences between zones, dates or laboratories are often useful starting points. They should trigger a sequence of checks rather than an immediate prescription.
Use the following table as a discussion tool with the laboratory or a local adviser.
| Difference observed | Context to check first | Focused question for an adviser or laboratory |
|---|---|---|
| Different pH values between zones | Depth, soil type, slope, past amendments and zone boundaries | Do these samples represent distinct management areas, and does the report method change how the difference should be read? |
| Different nutrient results in the same field | Sampling map, recent placement of inputs, manure history and crop history | Is this likely to justify separate follow-up sampling or a more detailed zone review? |
| A changed result over time | Same depth, season, laboratory method and sampling design | Are these reports sufficiently comparable to discuss a change rather than a sampling difference? |
| A soil-health score that appears inconsistent with other results | Method, sample handling, moisture conditions, land use and local soil context | What does this indicator measure in this reporting system, and what can it not establish? |
| A laboratory category that seems unexpected | Units, extraction method, stated crop and report legend | Can the laboratory explain the category and the assumptions behind it? |
This sequence avoids two common errors: assuming that a surprising value is a laboratory mistake, and assuming that it proves a specific field problem. Either conclusion may be possible in some cases, but neither follows from the number alone.
What global guidance can and cannot establish locally
The extension materials linked above provide useful general principles: sample representative areas, keep sampling procedures consistent, distinguish raw values from interpretations and read multiple indicators in context.
They do not establish China-specific soil thresholds, legal requirements, laboratory standards, crop recommendations or input decisions. Their examples and interpretive systems were developed for their own institutional and regional settings.
For a farm in China, the locally relevant reference point should be the current documentation from the testing laboratory and, where needed, advice from a qualified local agronomist or agricultural service familiar with the crop, soil conditions and applicable requirements. Keep the complete report available rather than sharing only selected figures. The method notes and report legend may be as important as the headline values.
Prepare a focused discussion with a local adviser or laboratory
The bounded next step is straightforward: send the complete report together with the sample-context record, then ask for interpretation within the farm’s actual production setting.
Useful questions include:
- Does the laboratory method and unit allow comparison with our earlier reports?
- Does the stated crop or production objective affect the report’s interpretation?
- Do our mapped zones and sampling depths support treating these results separately?
- Which management history is most relevant to interpreting this difference?
- Is further sampling, a revised sampling plan or another local reference needed before a decision is made?
A good soil test record does not remove uncertainty. It helps the team identify where uncertainty comes from: the sampled area, the method, the timing, the management history or the interpretive framework. That makes the next conversation more precise and reduces the risk of turning a single result into an unsupported universal instruction.
Source and further reading
ACA’s practical examples and working checklists are independent editorial analysis. The linked source provides the underlying reference; it does not endorse this article.